
Chapter 14's fountain kept its particles in a std::vector<Particle*>, each one made with new, and it said that most games would keep a std::vector<Particle> instead, with the particles themselves side by side in the vector's block. That's a claim about speed, and this chapter puts it to the test, with a stopwatch and a million of the fountain's particles. The results are more dramatic than you might guess. On my computer, the same loop, doing the same arithmetic to the same particles, took under two milliseconds, or 65, depending on nothing but where the particles sat in memory.
The reason is that a modern processor is astonishingly fast at arithmetic, and comparatively slow at fetching the numbers to do it on. Data locality is the pattern of laying data out so that the processor can stream through it: kept together, in the order it's used, with the parts that are used together packed tightly. This chapter measures each idea on real code, vectors against lists, objects against pointers, structures against arrays, hot data against cold, and virtual calls against three alternatives, so you can see the size of every effect for yourself, rather than taking anyone's word for it. Like the last chapter, it grew from a chapter of Robert Nystrom's Game Programming Patterns, and the end of the chapter says which of its ideas are his.
SDL3 Projects/Particle Timings — a console program, all in one main.cpp, that runs every experiment in this chapter and prints how long each took. Open Particle Timings.slnx, choosing Trust and Continue if Visual Studio asks, as in Chapter 1, switch it to Release, as the chapter explains, and press Ctrl+F5. It takes about fifteen seconds.In this chapter, we will:
- Measure how long it takes to fetch data from memory, near and far
- Time code honestly, in a Release build, with the best of several tries
- See why a vector beats a linked list, and why a vector of pointers can be slow
- Lay particles out as a structure of arrays, and keep hot data apart from cold
- Measure what virtual calls cost in a hot loop, and three ways around them
- Find where a program spends its time, with Visual Studio's Performance Profiler
- Decide when data locality is worth the trouble, and when it isn't
- Try an optional AI exercise on laying out a game's data
This is the one chapter in the book you can safely skip. Nothing later depends on it, and the games in this book never come near the limits it's about. If you're itching to start the final project, go ahead, and come back when a game of yours runs slowly and you want to know why.
If you're staying, let's start with a question you've probably never had to ask: how far away is your data?
How Far Away Is Your Data?
Your computer's memory isn't one pool that the processor reaches into, all at the same speed. Between the processor and the main memory, the RAM, sit several smaller memories called caches, each faster and smaller than the one after it. The smallest, the L1 cache, holds a few tens of kilobytes for each core, and answers in about a nanosecond. The L2 cache is bigger and a little slower, and the L3 cache, shared by all the cores, holds megabytes. RAM holds gigabytes, and it's the slowest of all.
When the processor needs a number, it looks in the caches first, nearest first, and only goes all the way to RAM if none of them has it. Two facts about caches matter for everything that follows. First, memory moves between them in cache lines of 64 bytes, so asking for one 4-byte float brings the 60 bytes around it along too, and if the next thing you want is among them, it's already there. Second, the processor watches how you read memory, and when it sees you walking steadily through it, it starts fetching the lines ahead of you before you ask, which is called prefetching. A fetch that finds its data in a cache is a cache hit, and one that has to go further is a cache miss.
How much further? The first test in Particle Timings measures it. It fills a block of memory with numbers, each saying where the next one is, in a random order, and times how long it takes to follow the chain. Here's how timeOneFetch builds the chain:
int count = kilobytes * 256;   // 256 ints to a kilobyte, 4 bytes each

// Every position, in a random order: walk down from the end, swapping
// each one with a random one at or before it
std::vector<int> order(count);
for (int i = 0; i < count; i++)
    order[i] = i;
for (int i = count - 1; i > 0; i--)
    std::swap(order[i], order[SDL_rand(i + 1)]);

// Link them into one big loop, in that order
std::vector<int> next(count);
for (int i = 0; i + 1 < count; i++)
    next[order[i]] = order[i + 1];
next[order[count - 1]] = order[0];
In the preceding code, count is how many ints fit in the given number of kilobytes, 256 to a kilobyte, since each is four bytes. The order vector starts out holding 0, 1, 2, and so on, and is then shuffled, by walking down from the end and swapping each element with a random one at or before it, with std::swap, from <utility>, which exchanges the two values it's given. That's a classic algorithm, the Fisher–Yates shuffle, and it makes every order equally likely. Then next turns the shuffled order into a chain: each element holds the position of the one after it in the shuffled order, and the last holds the first, so following the chain from anywhere visits every element once, and comes back around. Here's the rest of the function, which follows the chain ten million steps:
const int STEPS = 10000000;
double ms = timeIt([&next, &total]()
{
    int at = 0;
    for (int step = 0; step < STEPS; step++)
        at = next[at];
    total += at;   // use the answer, so the compiler can't skip the work
}, 3);

return ms * 1.0e6 / STEPS;   // milliseconds to nanoseconds, per fetch
In the preceding code, the lambda follows the chain, and timeIt, which the next section explains, times it. Every step reads the number that says where to go next, so the processor can't fetch ahead: it doesn't know the address it needs until the previous fetch arrives. That makes the loop a measure of pure waiting. The line after the loop adds the final position to total, which main prints at the end, for a reason the next section explains too.
The last line turns milliseconds into nanoseconds, a million to the millisecond, and divides by the number of steps, for the average time to fetch one number. Here's what my computer printed, for chains from 16 KB up to 256 MB:
Fetching one number from memory, with this much in play:
  16 KB                                      1.27 ns
  64 KB                                      1.81 ns
  256 KB                                     2.97 ns
  1 MB                                       4.21 ns
  4 MB                                      11.25 ns
  16 MB                                     19.84 ns
  64 MB                                     58.65 ns
  256 MB                                    77.76 ns
In the preceding output, a chain of 16 KB fits in the L1 cache, and each fetch took about 1.3 nanoseconds. As the chain outgrows each cache, the time steps up: 1.8 nanoseconds at 64 KB, 3.0 at 256 KB, and 4.2 at 1 MB, then 11 and 20 once the chain lives in the L3. At 64 MB and 256 MB, far bigger than any cache, nearly every fetch went all the way to RAM, and took 59, and then 78 nanoseconds. Figure 29.1 draws the ladder.
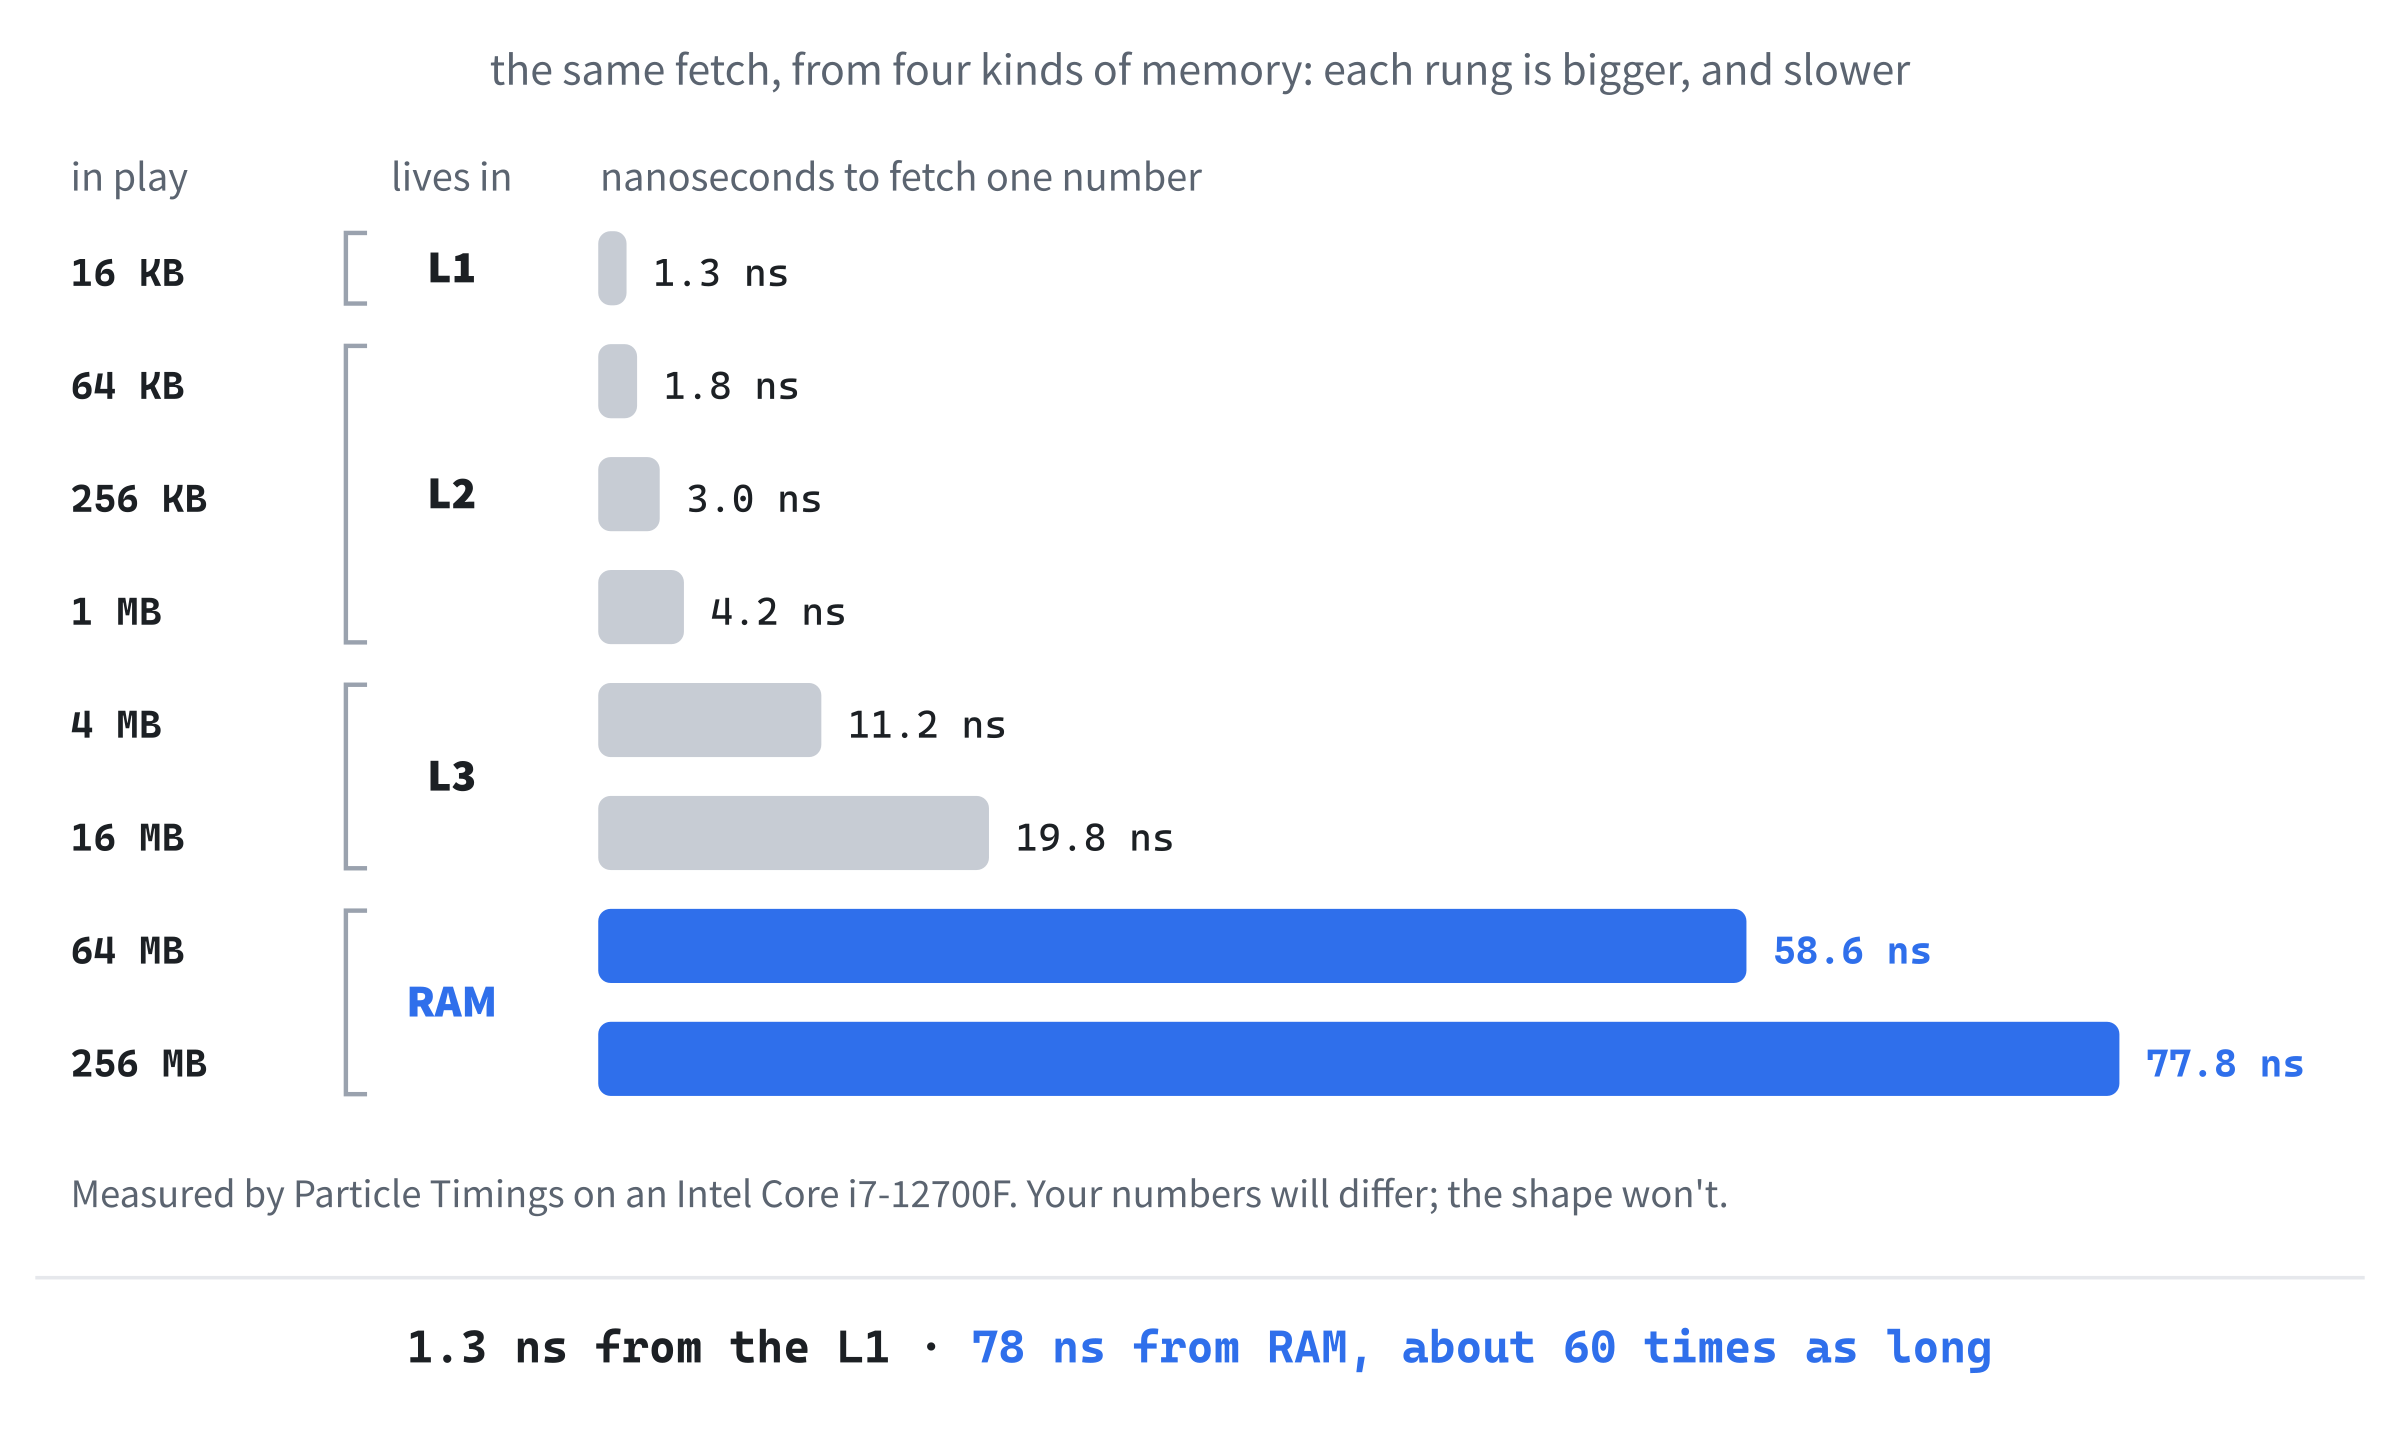
My computer's processor is an Intel Core i7-12700F. Its cores each have tens of kilobytes of L1 cache and a megabyte or so of L2, and all of them share 25 MB of L3, and you can see each boundary in the numbers. Yours will differ, but the shape won't: every computer made this century has a ladder like this one. To put the top rung in perspective, 78 nanoseconds is long enough for my processor to have done several hundred additions, and it spent all of them waiting.
That's the whole problem this chapter is about. A loop over memory that the caches already hold, or that the processor can see coming, runs at the speed of its arithmetic. Make the processor wait for RAM at every step, and the loop runs at the speed of the waiting.
Timing Code Honestly
Before trusting any number in this chapter, it's worth seeing how the numbers are made, because timing code is easy to get wrong in ways that give confident, wrong answers. The first rule is about the build.
Every project so far has been built as Debug, the configuration Chapter 13 recommended for testing: the standard library checks every vector index, and the compiler leaves the code unoptimized, so the debugger can follow it line by line. A Release build does the opposite, with no checks, and every optimization the compiler knows. To switch, open the dropdown on the toolbar that says Debug, beside x64, and choose Release. Then run the program with Ctrl+F5, which is Start Without Debugging on the Debug menu, since the debugger slows a program down too.
Never time a Debug build. It isn't just slower, it's slower by different amounts for different code, so it can point you the wrong way entirely. In a Debug build of this program, the structure of arrays you'll meet later took 34 milliseconds to the ordinary vector's 4.3, and you'd decide that the idea was hopeless. Built for Release, it's the faster of the two.
That warning comes from this program's own Debug build, and it's worth remembering long after the rest of this chapter. Here's the stopwatch that every test uses, timeIt:
// How long some work takes, in milliseconds. It does the work several
// times and keeps the fastest, because anything slower was held up by
// something else the computer was doing
double timeIt(const std::function<void()>& work, int tries = TRIES)
{
    double fastest = 1.0e9;
    for (int i = 0; i < tries; i++)
    {
        Uint64 start = SDL_GetTicksNS();
        work();
        double ms = (SDL_GetTicksNS() - start) / 1.0e6;
        if (ms < fastest)
            fastest = ms;
    }
    return fastest;
}
In the preceding code, the work to be timed arrives as a std::function, Chapter 24's way of holding any function, so each test can hand it a lambda. The clock is SDL_GetTicksNS, the nanosecond clock that Chapter 27 used, read before and after the work, and the difference, divided by a million, is in milliseconds. The work is done tries times, 15 unless the caller asks for a different number, and only the fastest counts. Anything slower than the fastest wasn't the code's fault: the computer was busy with something else for a moment, as computers always are.
The second trap is the optimizer itself. A Release build removes any work whose result is never used, and a timing loop often looks exactly like that. The chain-following loop reads a number and moves on, and if nothing ever looked at where it ended up, the compiler would be entitled to delete the whole loop, and report that fetching ten million numbers took no time at all. That's why the lambda adds its final position to total, and main prints it. The particle tests change the particles, which live on after each test, so the compiler has to assume that someone might look at them.
The third trap is subtler. Every frame, moveParticle changes the particles: they fall, and bounce, and pile up on the floor. If the tests ran one after another on the same particles, the later ones would be moving a different crowd, bunched on the floor and bouncing, and the comparison wouldn't be fair. So main makes a million particles once, and every test starts from a copy of them:
// A million particles, made once. Every test starts from a copy of
// these, so they all do exactly the same work
std::vector<Particle> start;
for (int i = 0; i < COUNT; i++)
    start.push_back(randomParticle());

std::cout << "\nMoving " << COUNT << " particles on by one frame:\n";
std::vector<Particle> particles = start;
report("a vector of particles", timeVector(particles));
In the preceding code, start holds the million particles, made by randomParticle, which scatters them around the 800-by-600 space with random sizes and speeds, like Chapter 14's fountain in full flow. Each test copies start into its own container, and moves that, and its fifteen tries move it on fifteen frames: the same fifteen frames for every test. The first test moves a vector of particles, and report prints one line of the results:
// One line of the results: what was timed, and how long it took, in
// milliseconds unless it says otherwise
void report(const std::string& what, double time,
            const std::string& unit = "ms")
{
    std::cout << "  " << std::left << std::setw(40) << what << std::right
              << std::setw(7) << time << " " << unit << "\n";
}
In the preceding code, std::setw, from <iomanip>, sets the width of the next thing printed, padding it with spaces, and std::left and std::right say which side the padding goes, so the labels line up in one column and the times in another. The top of main sets two things up for every test:
int main()
{
    SDL_srand(29);   // the same random numbers every time it runs
    std::cout << std::fixed << std::setprecision(2);
In the preceding code, SDL_srand, from Chapter 9's note on seeds, makes the program use the same random numbers every time it runs, so it makes the same million particles, and std::fixed and std::setprecision(2) print every number with two digits after the point. One more thing before reading any results: they're mine, from one computer, and yours will differ, perhaps a lot. What carries over is the shape, which layouts are faster, and roughly by how much, so run the program yourself, and read your numbers beside mine.
Vectors and Lists
The particles in every test are Chapter 14's, with the same seven members:
// Chapter 14's particle: a colored square with a position and a velocity
struct Particle
{
    float x;           // the top-left corner, in pixels
    float y;
    float velX;        // the velocity, in pixels per second
    float velY;
    float size;        // the width and height, in pixels
    SDL_Color color;
    float life;        // seconds left before it fades away
};
In the preceding code, six floats of four bytes each and a four-byte SDL_Color make 28 bytes, so a 64-byte cache line holds just over two particles, and a million particles fill 28 MB, more than my computer's L3 cache can hold. The program moves them with Chapter 14's moveParticle, changed only to take a reference rather than a pointer, so it can move a particle wherever it's kept. Here's the first test, on a vector:
// The particles themselves, side by side in one block
double timeVector(std::vector<Particle>& particles)
{
    return timeIt([&particles]()
    {
        for (Particle& p : particles)
            moveParticle(p, DELTA);
    });
}
In the preceding code, the lambda moves every particle in the vector on by one frame, and timeIt times it. The vector's particles sit side by side in one block, as Chapter 13 showed, so the loop walks through memory in a straight line.
Chapter 15 promised that this chapter would meet std::list, and show why a vector usually beats it anyway. A linked list keeps each element in a small block of its own on the heap, called a node, along with two pointers: one to the next node, and one to the one before. Walking the list means following the pointers from node to node. Adding or removing an element in the middle of a list only relinks the nodes on either side, where a vector has to shuffle every element after the gap along, and that's a list's great strength. Walking one looks exactly like walking a vector:
// A linked list: every particle in a node of its own, allocated alone,
// with pointers to the nodes on either side
double timeList(std::list<Particle>& particles)
{
    return timeIt([&particles]()
    {
        for (Particle& p : particles)
            moveParticle(p, DELTA);
    });
}
In the preceding code, the loop is word for word the one in timeVector, with only the container's type changed. A range-based for works on any standard container, and it hides how the elements are kept, which is exactly what this chapter is about to lift the lid on.
The vector and the list are each tested twice, once as they were made, and once after sorting the particles by how far across the window they are. Sorting a vector moves the particles themselves around inside its block. A list can't be sorted with std::sort, which needs to jump straight to any element, as a vector can, so a list has a sort function of its own, which relinks the nodes into the new order without moving them:
std::list<Particle> sortedList(start.begin(), start.end());
sortedList.sort(isLeftOf);
report("a list of particles, sorted", timeList(sortedList));
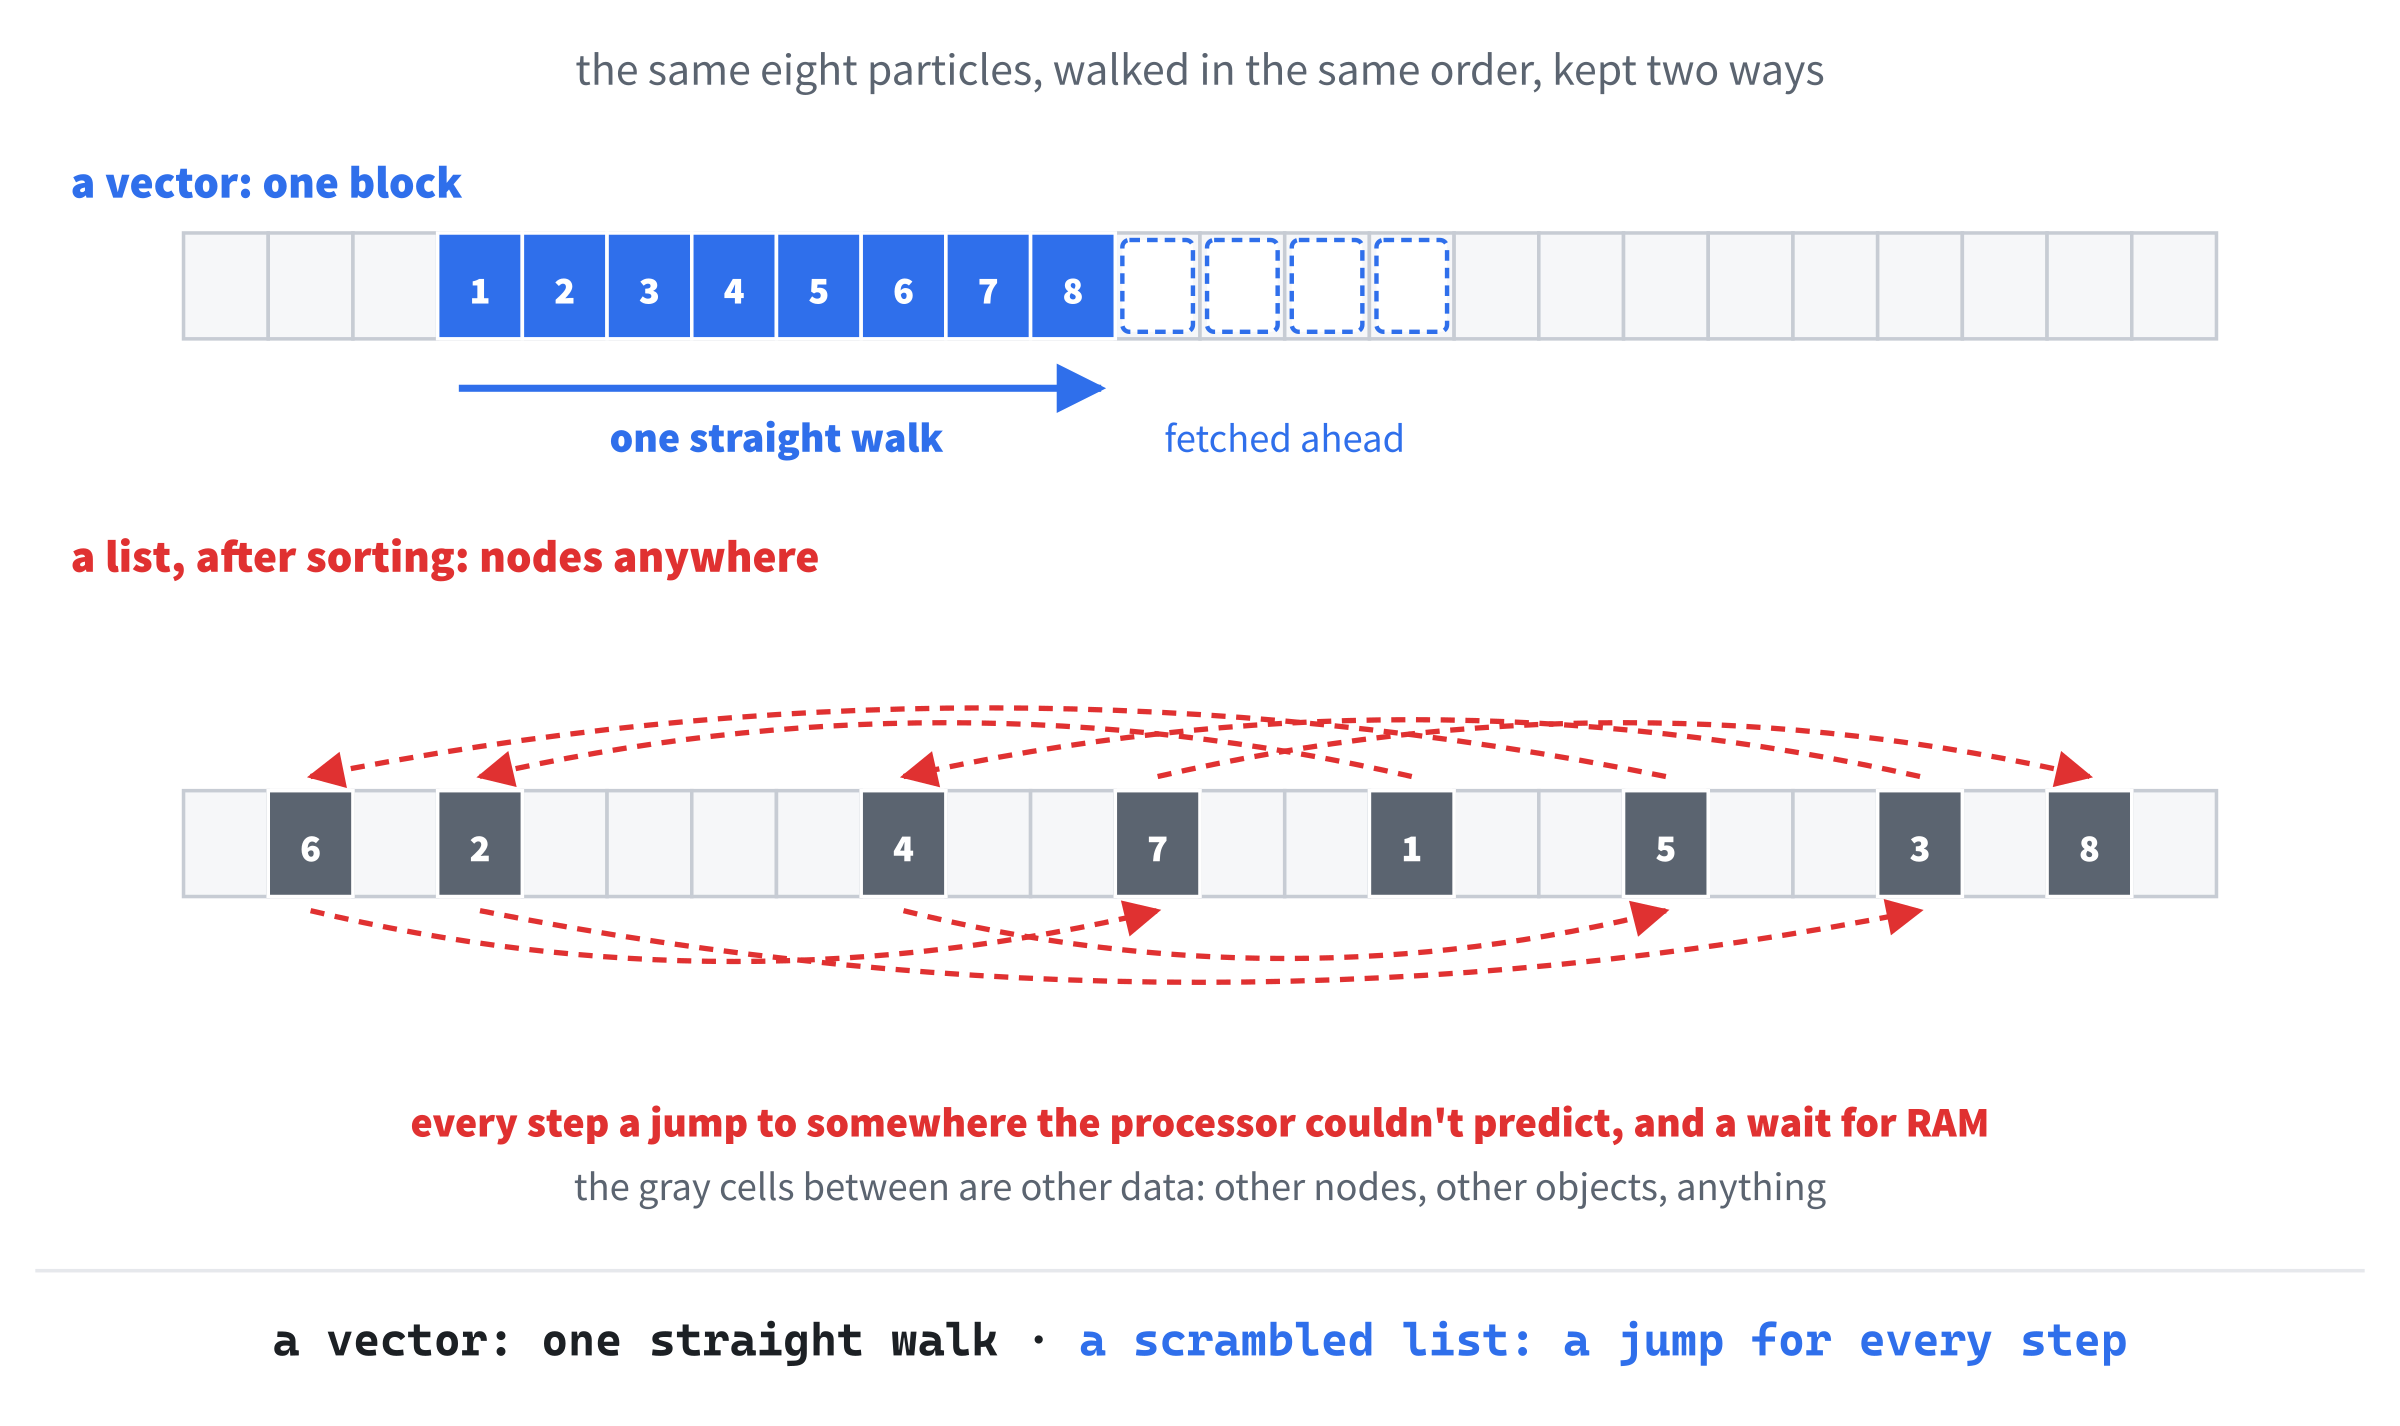
In the preceding code, the list is made from start’s particles, and sorted with isLeftOf, a function that says whether one particle is left of another, a.x < b.x, the kind of rule Chapter 24's std::sort wanted. Afterward, the list visits the particles from left to right, but their nodes are still wherever they were made, so each step jumps somewhere unpredictable in memory. That's what happens to a real game's list over time, as elements come and go in a different order from the one they were made in, and the sort just does it all at once. Here are the four results:
Moving 1000000 particles on by one frame:
  a vector of particles                      1.91 ms
  a vector of particles, sorted              1.91 ms
  a list of particles                        7.04 ms
  a list of particles, sorted               65.47 ms
In the preceding output, the vector took 1.9 milliseconds, sorted or not: its particles are side by side either way, so the processor walks straight through memory, and prefetching keeps the caches a step ahead. The list, as made, took 7.0, over three and a half times as long. Its nodes were made one after another, and sit near each other, but each is a block of its own, with its two pointers and the heap's bookkeeping around it, so there's more memory to get through, and every step waits for a pointer before it knows where to go next. After sorting, the list took 65 milliseconds, 34 times as long as the vector, for exactly the same arithmetic.
Now look back at the first test. Sixty-five milliseconds for a million particles is 65 nanoseconds a particle, which is just what a trip to RAM cost there. The sorted list is doing what the chain-following loop did: fetching every particle from somewhere the processor couldn't predict, and waiting for it. Figure 29.2 shows the difference.
So is a list ever the right choice? Occasionally, when elements are added and removed in the middle of a long sequence far more often than the sequence is walked, or when each element has to stay at the same address while others come and go. Games rarely need either, and when they do, there's usually a vector-based trick that does the job, such as Chapter 14's swap-and-pop. The rule of thumb in modern C++ is to reach for a vector first, and for anything else only with a reason.
Pointers to Particles
Chapter 14 kept its particles as a std::vector<Particle*>, and here's its loop, timed:
// Chapter 14's way: a vector of pointers, each to a particle made with new
double timePointers(std::vector<Particle*>& particles)
{
    return timeIt([&particles]()
    {
        for (Particle* p : particles)
            moveParticle(*p, DELTA);
    });
}
In the preceding code, the vector holds pointers, eight bytes each, side by side, and each points to a particle made with new, somewhere on the heap. The loop reads a pointer, and then follows it to the particle, as Chapter 14's did. As with the list, there are two versions of the test: the pointers in the order the particles were made, and the pointers sorted by isLeftOf, which leaves the particles where they are, and scrambles the order they're visited in. A smart-pointer version, a vector of std::unique_ptr<Particle>, is sorted the same way. Here are the three results:
a vector of pointers                       3.89 ms
a vector of pointers, sorted              12.00 ms
a vector of unique_ptrs, sorted           12.04 ms
In the preceding output, the vector of pointers took 3.9 milliseconds with the particles in the order they were made, twice as long as the vector of particles, and 12 after sorting, over six times as long. Made one after another, the particles landed near each other on the heap, each in a slot of 48 bytes, though not strictly in order, so the processor still found much of what it needed nearby. Sorting the pointers scattered the order they're visited in, and the loop started waiting on RAM. The vector was never the problem: it's where the pointers point that matters. Figure 29.3 lays the first seven results side by side.
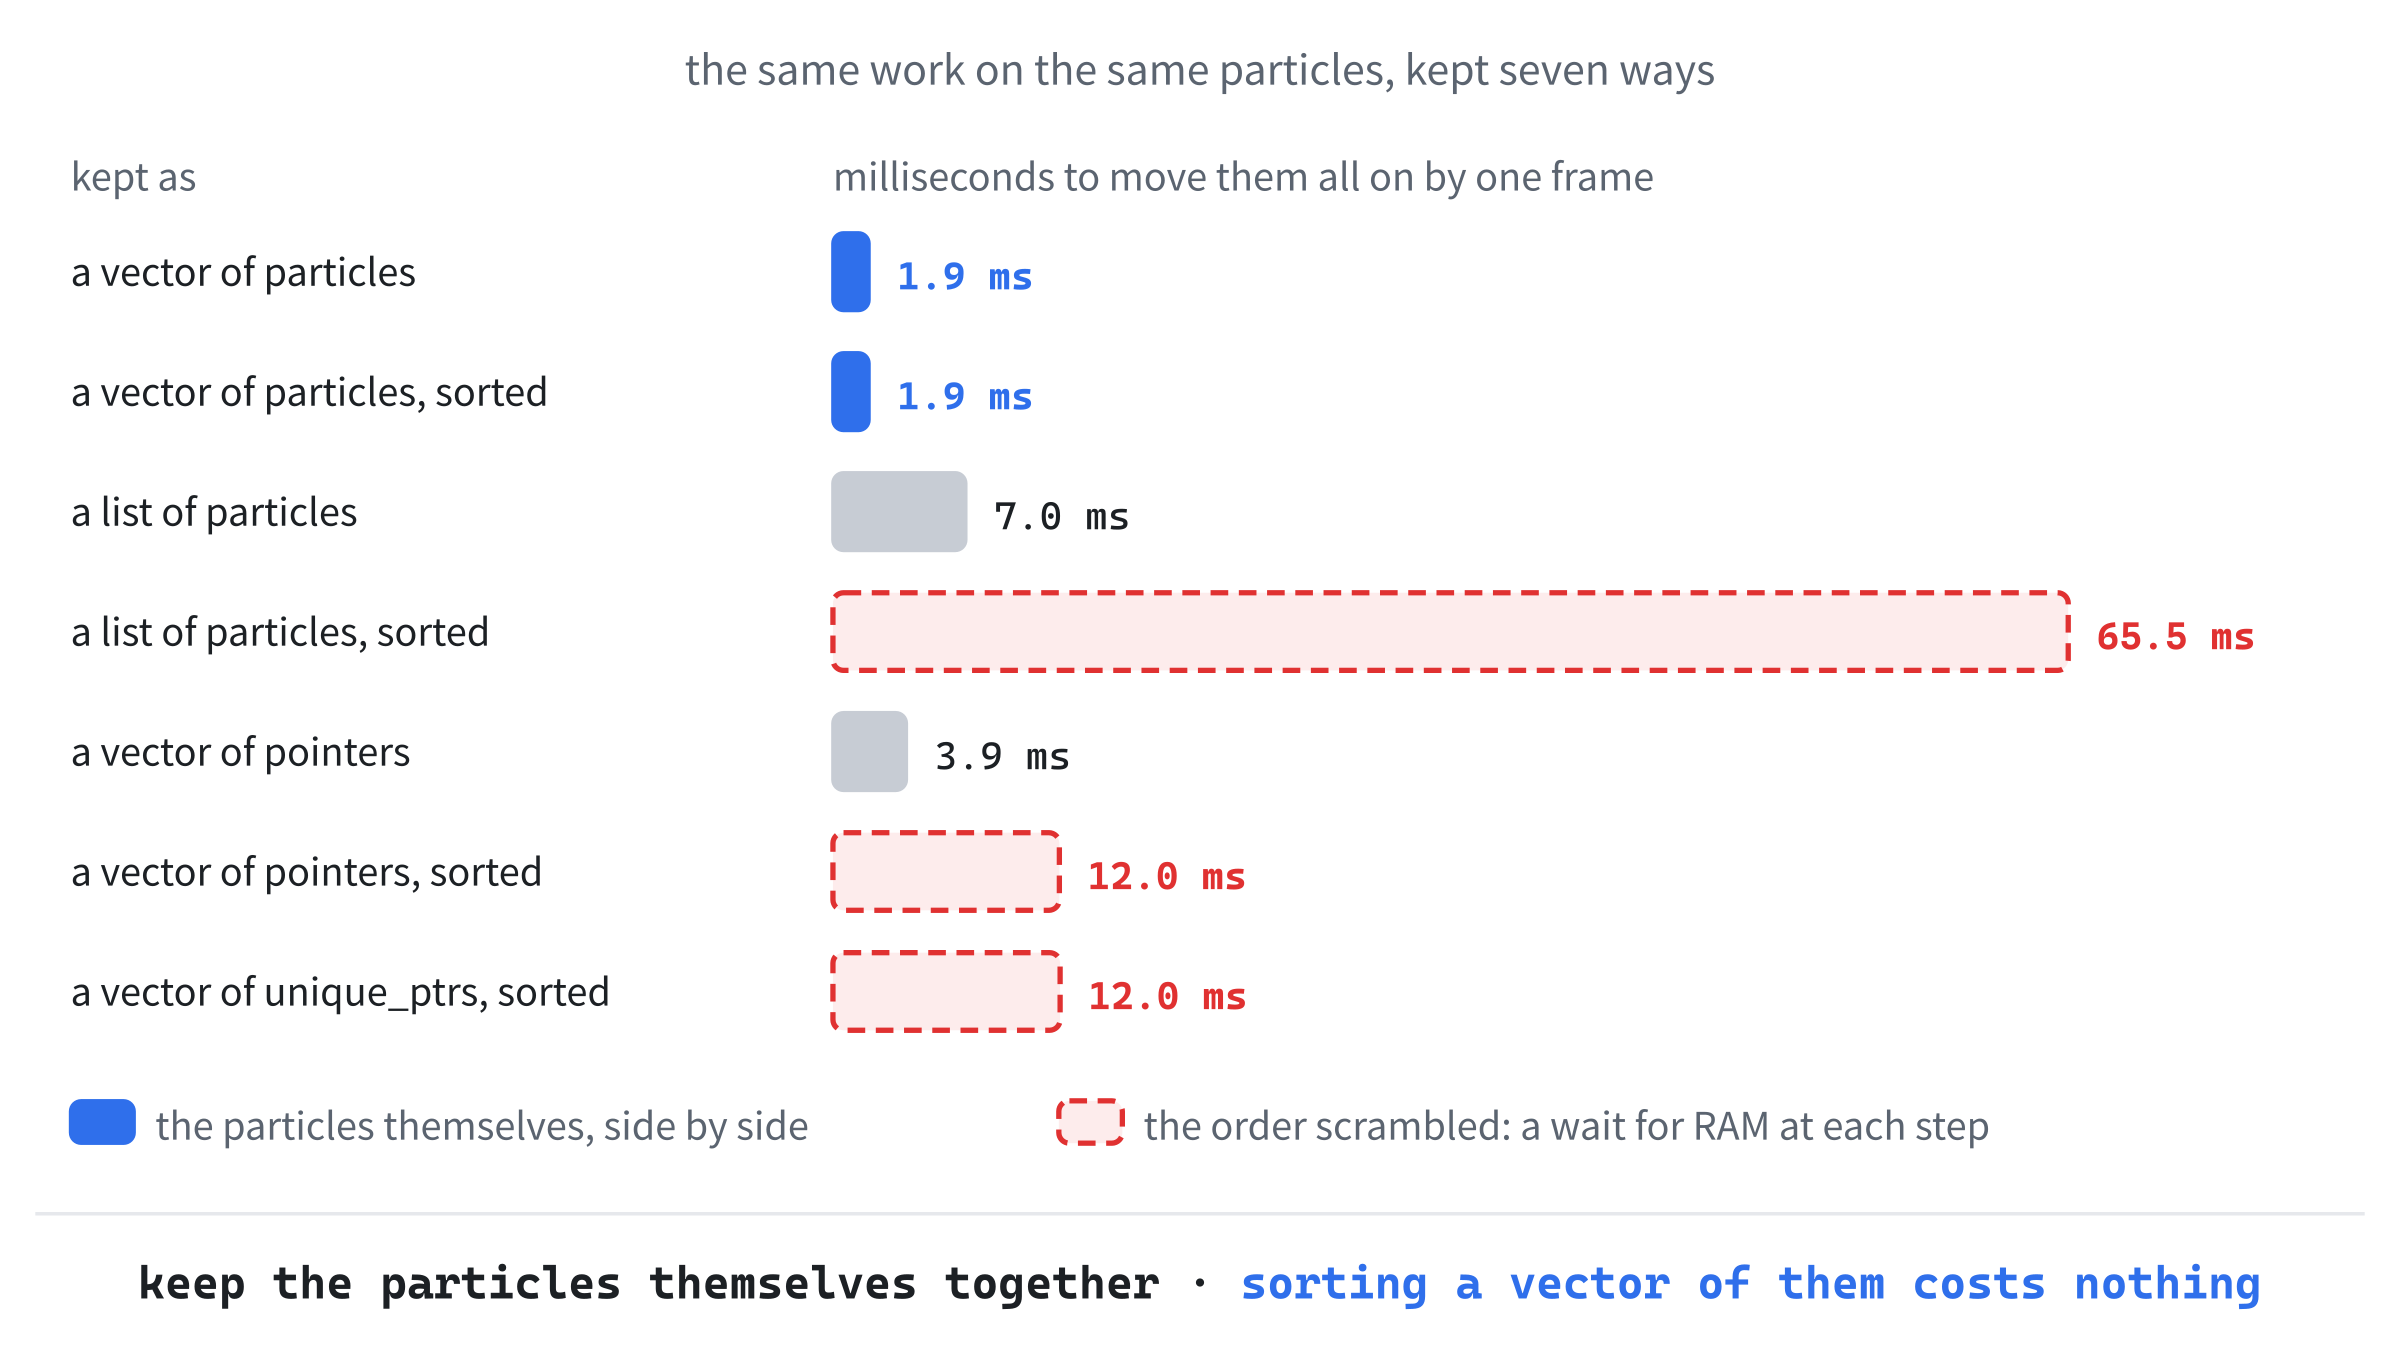
Smart pointers don't help here, and they don't claim to. A std::unique_ptr decides when a particle is deleted, not where it lives, so the sorted vector of unique_ptrs took 12 milliseconds, just like the raw pointers. Chapter 10's advice stands: use smart pointers for ownership. For speed, keep the objects themselves in the vector.
Real games scramble their pointers without any sorting. Chapter 14's removeFaded fills each gap with the last particle, so the order changes every time one fades, and the heap hands freed memory to new particles wherever it has some. After a few minutes of a busy fountain, a vector of pointers visits its particles in something close to random order, which is the sorted case above. Chapter 14's verdict, that most games would use a std::vector<Particle>, now has numbers behind it: here, between two and six times as fast.
Structures of Arrays
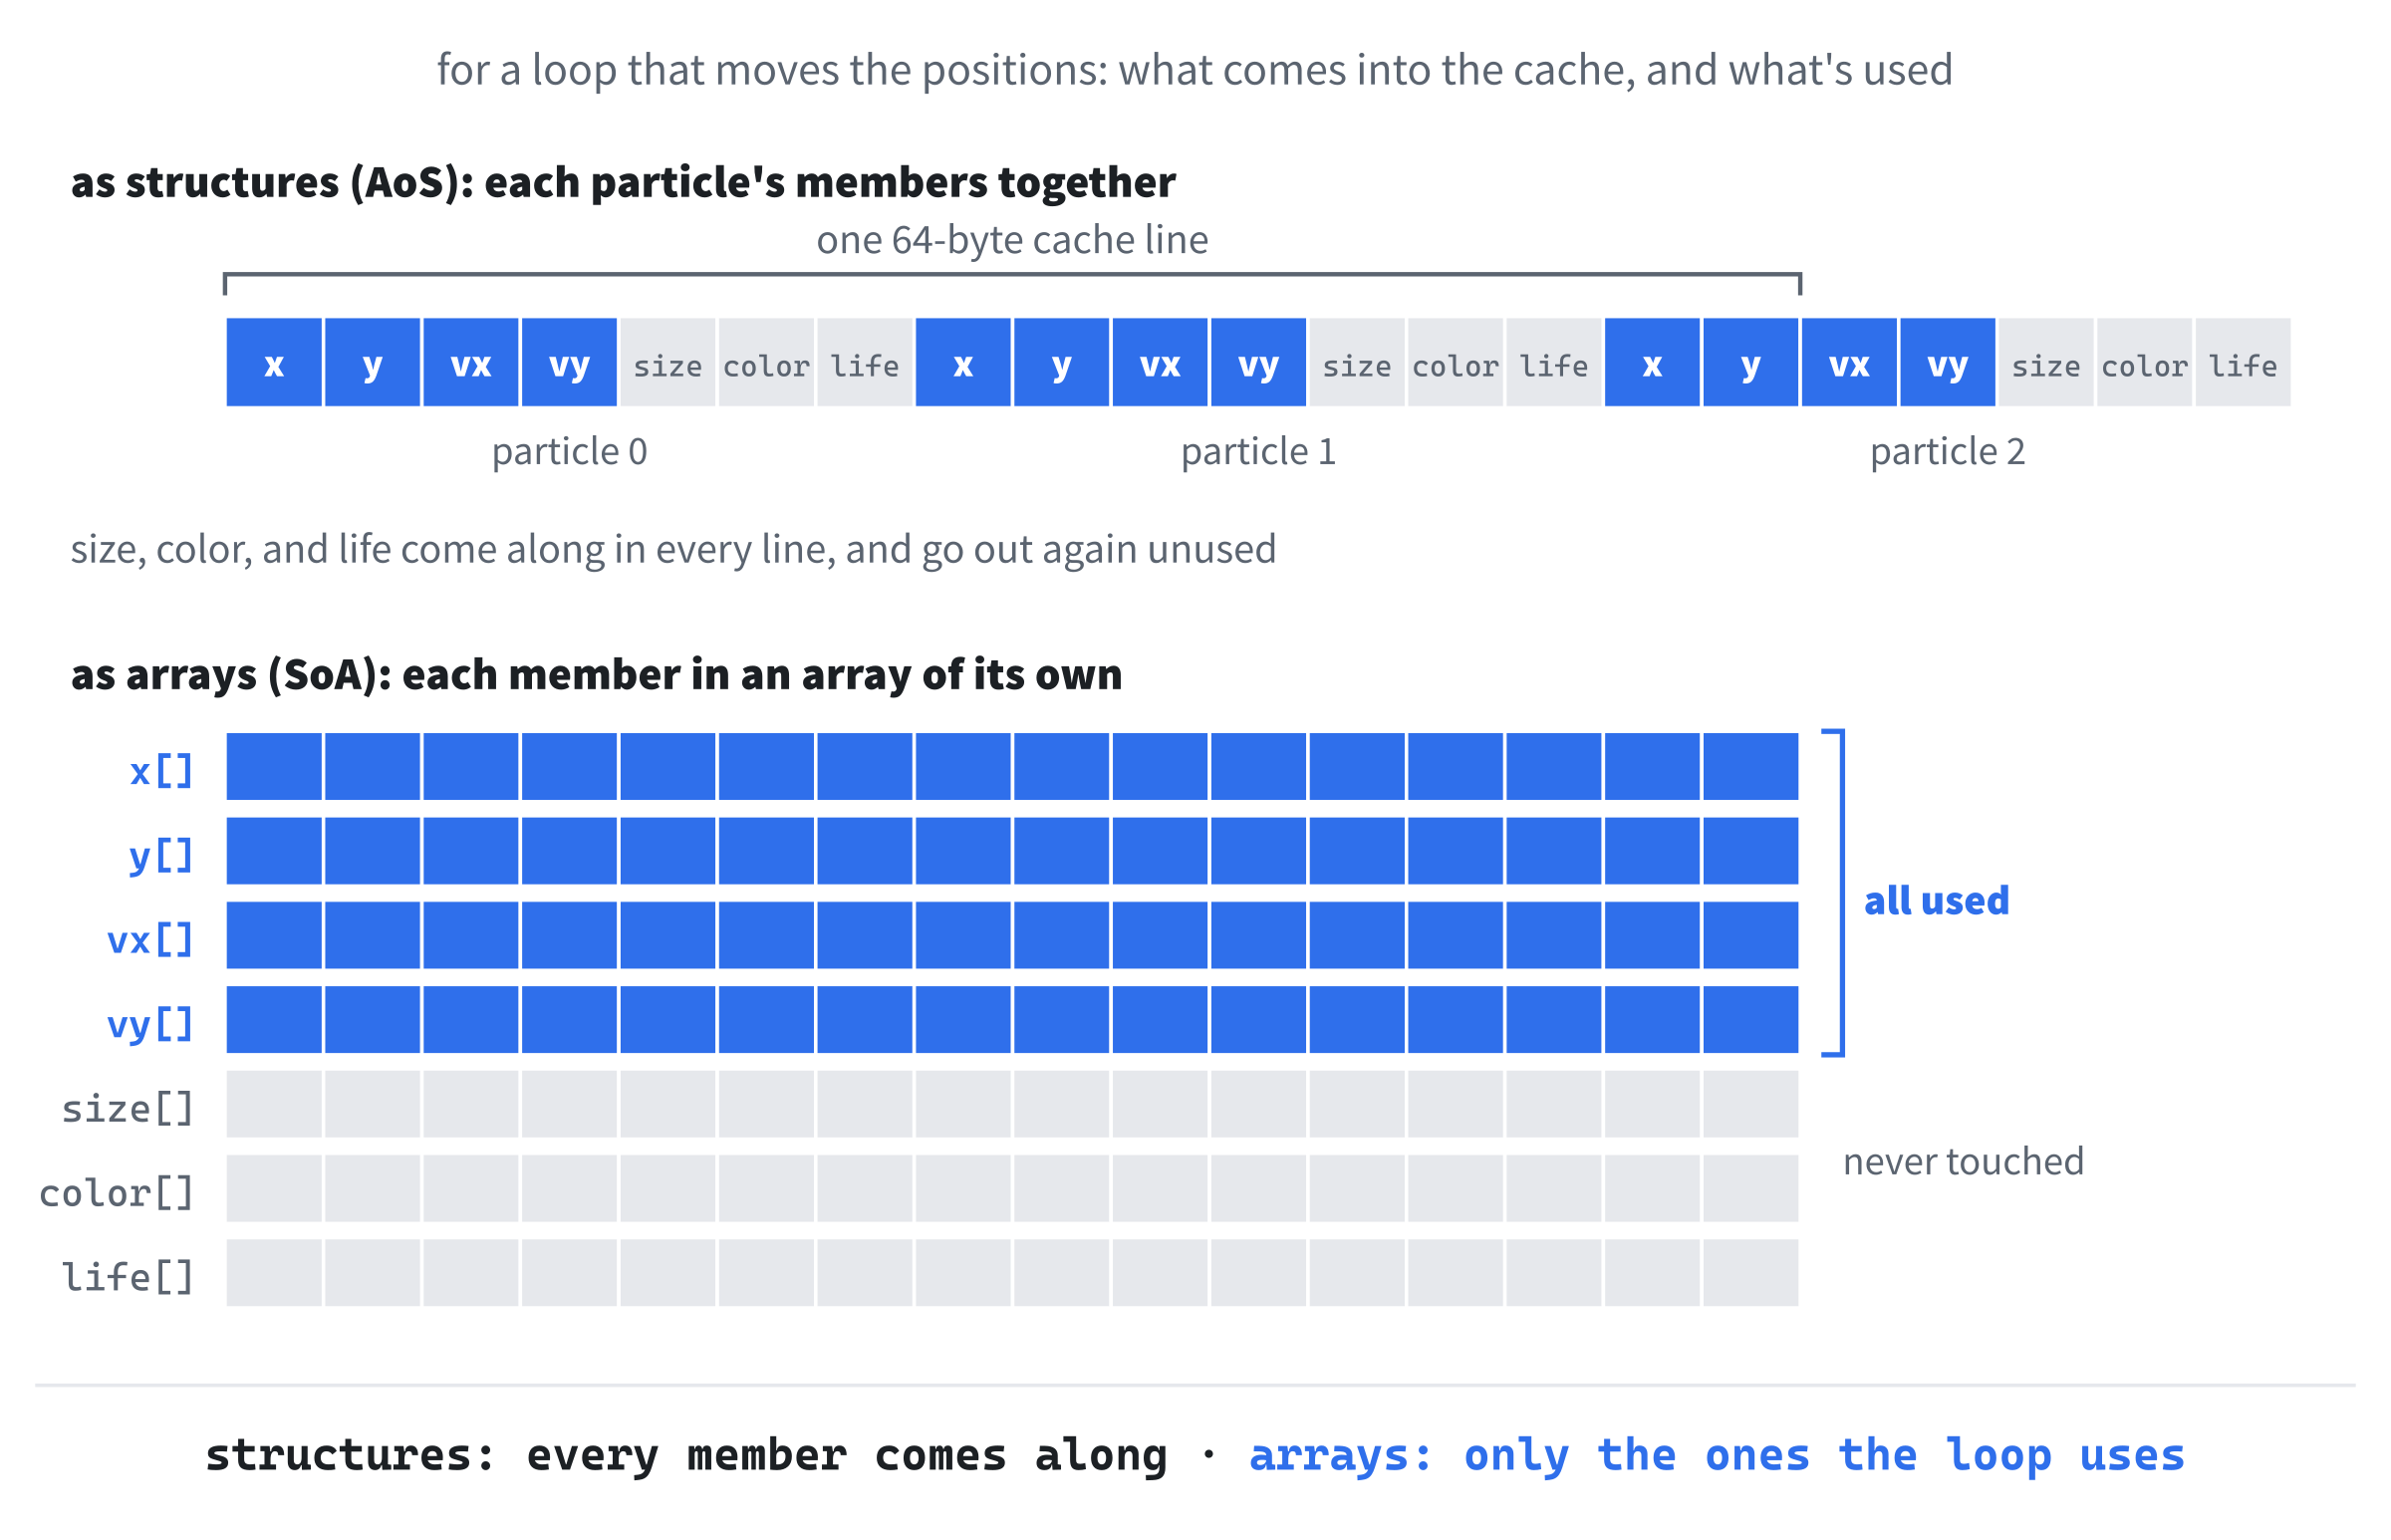
A std::vector<Particle> is an array of structures, or AoS: one structure after another, each holding every member of one particle. There's another way to keep the same data. A structure of arrays, or SoA, keeps one array for each member instead:
// The same particles, kept as a structure of arrays: one array for each
// member of Particle, so particle i is x[i], y[i], and so on
struct ParticleArrays
{
    std::vector<float> x;
    std::vector<float> y;
    std::vector<float> velX;
    std::vector<float> velY;
    std::vector<float> size;
    std::vector<SDL_Color> color;
    std::vector<float> life;
};
In the preceding code, ParticleArrays has seven vectors, one for each of Particle’s members, and particle number i is spread across all seven: its position is x[i] and y[i], its velocity velX[i] and velY[i], and so on. The toArrays function, below it in the file, copies each particle's members into the arrays. Figure 29.4 shows the two layouts in memory.
Why would anyone want that? Look at a loop that only moves the particles along by their velocities, first as structures:
// Only the positions, from the velocities: the particles as structures
double timeStructPositions(std::vector<Particle>& particles)
{
    return timeIt([&particles]()
    {
        for (Particle& p : particles)
        {
            p.x += p.velX * DELTA;
            p.y += p.velY * DELTA;
        }
    });
}
In the preceding code, the loop reads each particle's velocity and changes its position, which are 16 of its 28 bytes. The other 12, its size, color, and life, come into the cache with it anyway, because they're in the same cache lines, and go out again unused. As arrays, the same loop looks like this:
// Only the positions, from the velocities: the particles as arrays
double timeArrayPositions(ParticleArrays& a)
{
    return timeIt([&a]()
    {
        for (size_t i = 0; i < a.x.size(); i++)
        {
            a.x[i] += a.velX[i] * DELTA;
            a.y[i] += a.velY[i] * DELTA;
        }
    });
}
In the preceding code, the loop steps an index, i, a size_t like the one in Chapter 14's removeFaded, along four of the arrays at once, and never touches the other three. Every byte it brings into the cache is one it uses. The program also times both layouts doing everything moveParticle does, with a function called moveArrays for the arrays. Here are the four results:
Structures and arrays:
  positions only, as structures              0.88 ms
  positions only, as arrays                  0.64 ms
  everything, as structures                  1.91 ms
  everything, as arrays                      1.60 ms
In the preceding output, the positions alone took 0.88 milliseconds as structures, and 0.64 as arrays, about a quarter less. That's a real gain, but not a dramatic one, because a vector of structures is already friendly to the cache: the waste was 12 bytes in every 28, not a trip to RAM for every particle. For everything moveParticle does, the arrays took 1.60 milliseconds to the structures' 1.91. The loop in moveParticle touches every member but the color, so the arrays have only one member in seven to skip, and the two layouts should be close. In a smaller test program, with the same loops, the structures won by about as much, which is a reminder that small differences in timing can come from small differences in how the compiler arranges a loop.
Arrays of plain floats walked in step are also what the processor's SIMD instructions work best on, which do the same arithmetic on four or eight numbers at once. Here, Visual Studio's compiler didn't use them for the arrays, so the gain above came from the memory alone.
Structures of arrays have real costs, too. There's no such thing as a particle anymore, only an index, so a function that works on one particle needs the whole ParticleArrays and a number. Adding a particle means seven push_back calls, and removing one means seven removals, all kept in step, which is exactly the kind of bookkeeping that goes quietly wrong. Keep them for the loops that really need them: big ones, run every frame, that use only a few members of each element.
Hot and Cold
The positions-only loop hinted at a bigger idea. Every member of a structure travels into the cache with every other, so a member that's rarely used still costs something whenever its neighbors are. Members that are read every frame are called hot, and members that are read now and then are cold. Here's a particle with some cold data:
// What the game hardly ever reads about a particle: where and when it was
// born, which burst it came from, and a label for the debugger
struct ParticleHistory
{
    float bornX;
    float bornY;
    float bornAt;      // seconds after the game started
    int burst;
    std::string label;
};

// A particle that carries its history around with it
struct FatParticle
{
    Particle particle;          // read every frame
    ParticleHistory history;    // read almost never
};
In the preceding code, a ParticleHistory records where and when a particle was born, which burst it came from, and a label to help when debugging, and a FatParticle carries one around with its Particle. The history might be useful one day, to replay a burst, say, or to track down a particle that misbehaves, but the fountain never reads it while it runs. The label is a std::string, which is 32 bytes on its own in a Release build, and the program prints the sizes: 28 bytes for a Particle, and 80 for a FatParticle.
Moving the fat particles needs only their Particle parts, as before. The alternative is to keep the histories in a vector of their own, beside the particles, with history number i belonging to particle number i:
std::vector<Particle> hot = start;
std::vector<ParticleHistory> cold(COUNT);
report("particles, with histories kept apart", timeVector(hot));
In the preceding code, hot holds the particles, and cold holds their histories, in the same order, and the loop that moves the particles never goes near cold. Here's how the two did:
Hot and cold (a Particle is 28 bytes, a FatParticle 80):
  fat particles, history inside              4.26 ms
  particles, with histories kept apart       1.92 ms
In the preceding output, the fat particles took 4.26 milliseconds, more than twice as long as the lean ones, at 1.92, for exactly the same work on exactly the same particles. A 64-byte cache line holds more than two lean particles, but not even one fat one, so the fat loop drags nearly three times as much memory through the caches, and Figure 29.5 shows why. Splitting hot data from cold is often the easiest win in this chapter, because it doesn't change any loop, only where the cold members live.
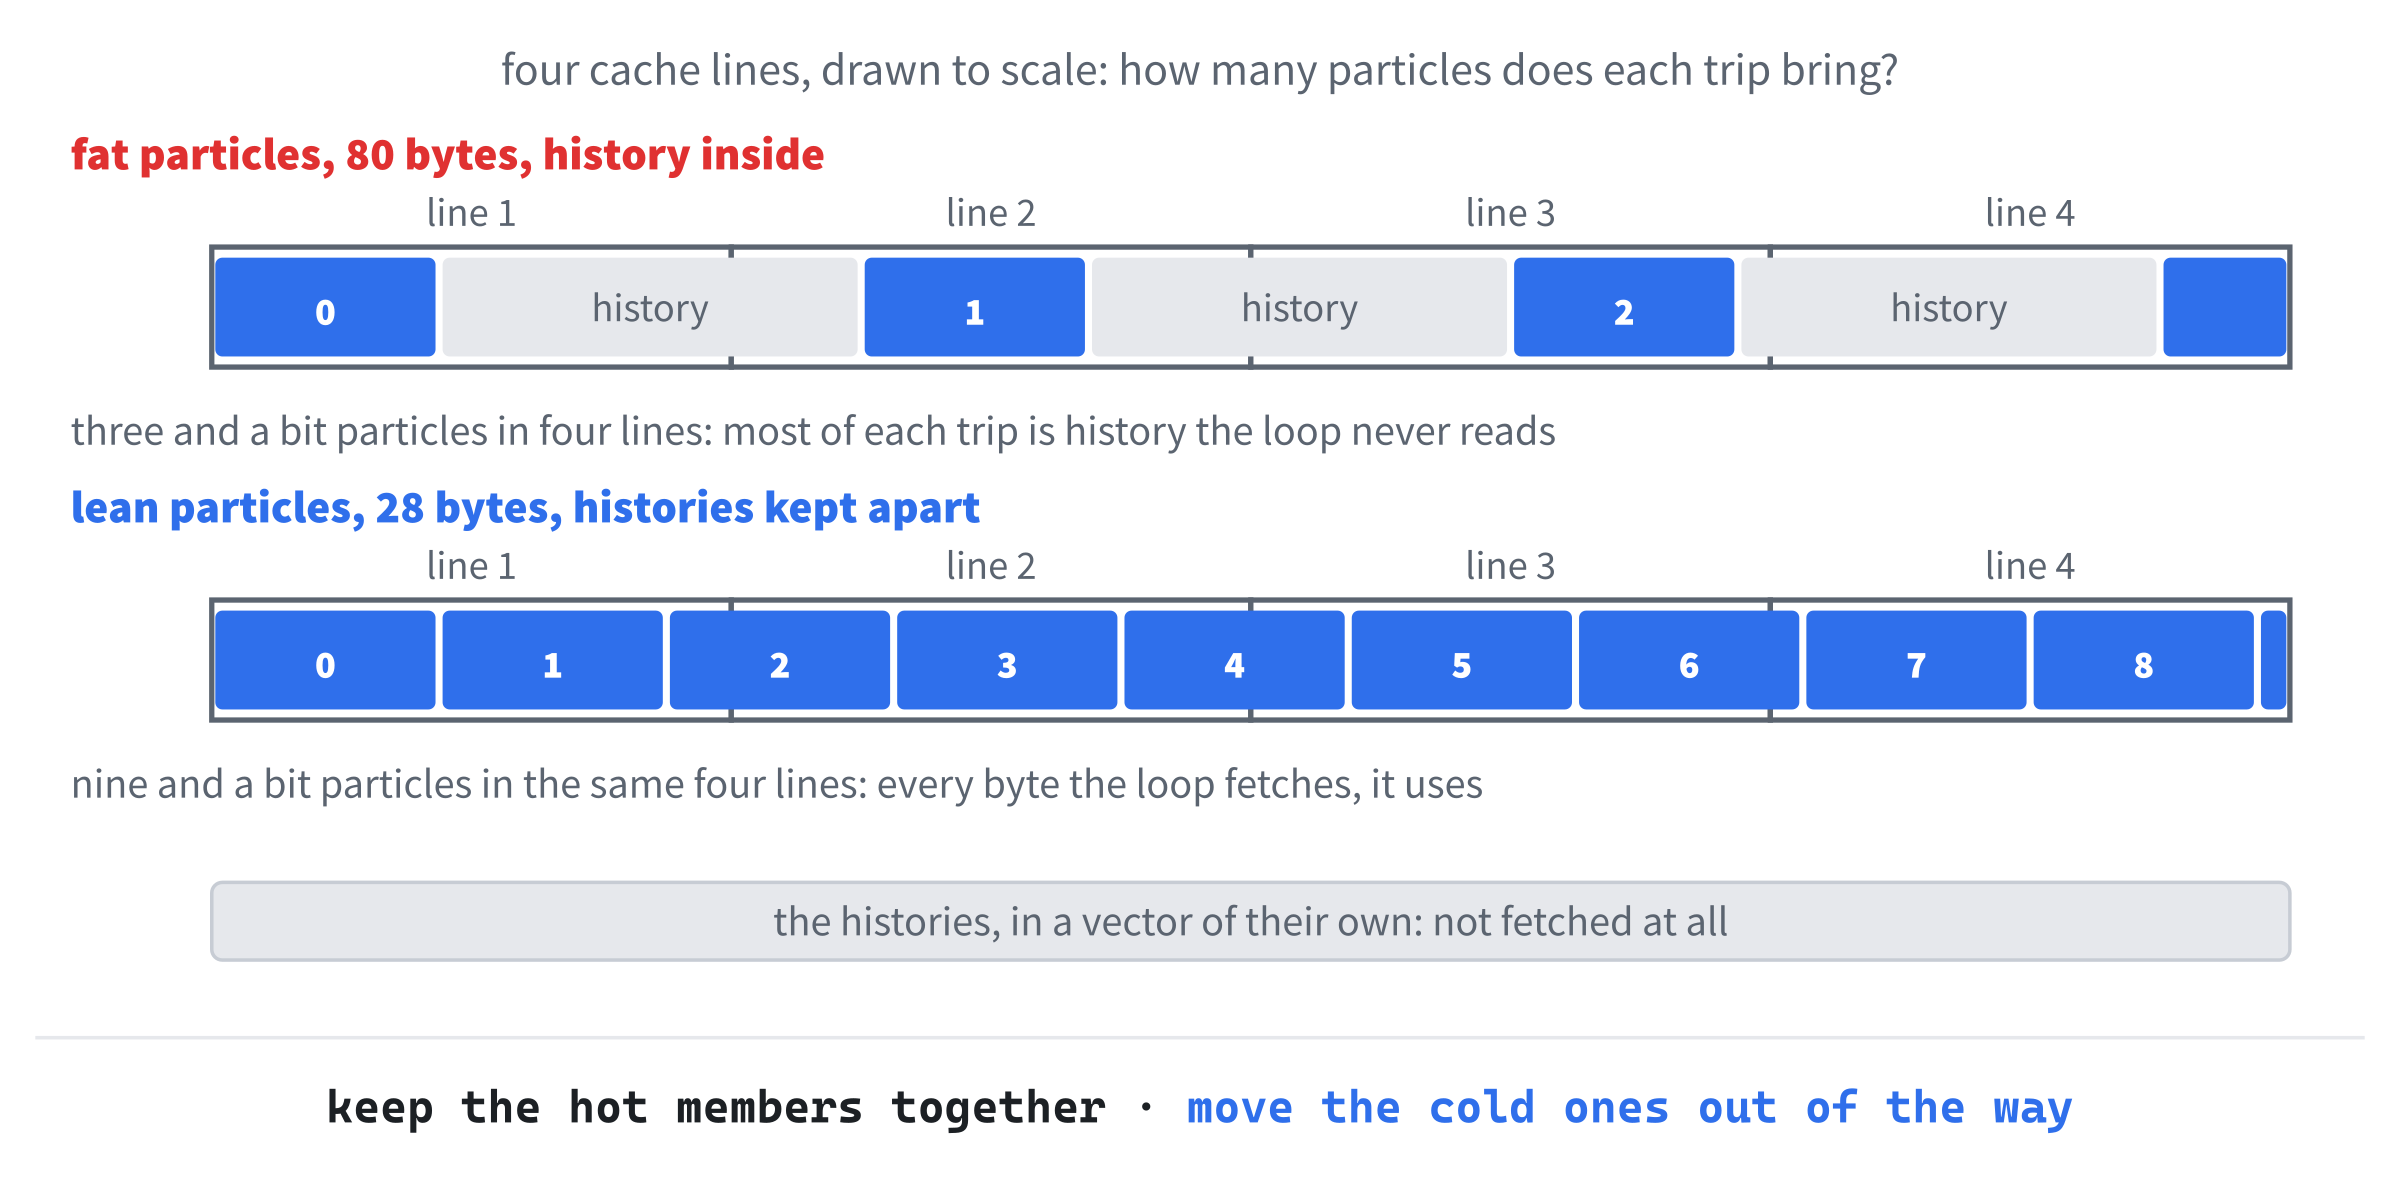
Check a structure's size with sizeof whenever you're about to make a million of something, as this program does for its hot and cold test. In a Release build, a std::string is 32 bytes and a std::vector 24, not counting anything they keep on the heap, and a structure is padded out to a multiple of its widest member's alignment. A size that surprises you is often cold data in a hot place.
This is the last chapter's idea, seen from the memory's side. Splitting a runner into input, physics, and graphics kept each job's code apart. An Entity-Component-System keeps each kind of component's data apart too, in an array of its own, and that's why Figure 28.11's flipped loop pays: the physics system walks a tight array of nothing but physics, the way the lean loop here walks nothing but particles, and never drags the graphics through the cache.
Virtual Calls in a Hot Loop
Chapter 22 said that virtual functions cost a little, that for a hundred thousand particles in a tight loop it could matter, and that this chapter would look at what games do when it does. Here's the experiment. Some particles fall, like the fountain's, and some float, like bubbles:
// A bubble's move: no gravity, and it rises or sinks slowly
void floatParticle(Particle& p, float delta)
{
    p.life -= delta;
    p.x += p.velX * delta;
    p.y += p.velY * 0.25f * delta;
}
In the preceding code, floatParticle is a lighter version of moveParticle: the particle ages and moves, but only a quarter as fast up or down, and with no gravity and no walls. The book's usual way to have two kinds of something that behave differently is Chapter 22's: a base class with a virtual function, and a derived class for each kind:
// A particle that moves itself, through a virtual function, as Chapter
// 28's inputs decide for their runners
class MovingParticle
{
public:
    virtual ~MovingParticle() = default;
    virtual void move(float delta) = 0;

    Particle particle;
};
In the preceding code, MovingParticle has a virtual destructor, as Chapter 22's rule requires, a pure virtual move, and the particle itself, public to keep the tests short. Below it in the file, FallingParticle overrides move to call moveParticle, FloatingParticle overrides it to call floatParticle, and makeMoving makes one of either kind on the heap, in a std::unique_ptr. The test is Chapter 23's kind of loop, a call through the base class for every particle:
double timeVirtual(std::vector<std::unique_ptr<MovingParticle>>& particles)
{
    return timeIt([&particles]()
    {
        for (std::unique_ptr<MovingParticle>& p : particles)
            p->move(DELTA);
    });
}
In the preceding code, each call follows a unique_ptr to wherever its particle lives, then the object's vptr to its class's table, and then calls whichever move the table names, as Figure 22.3 showed. There are two other ways to have two kinds of particle. One is Chapter 11's: an enum class, Kind, defined a little further up the file, with the values Kind::Falling and Kind::Floating, and a structure that pairs each particle with its kind:
// The other way to have two kinds: say which kind each one is, and switch
struct KindOfParticle
{
    Particle particle;
    Kind kind;
};
In the preceding code, a KindOfParticle is a Particle with a Kind beside it, so a vector of them keeps the particles side by side, with no new and no pointers. A switch chooses the move for each one:
double timeSwitch(std::vector<KindOfParticle>& particles)
{
    return timeIt([&particles]()
    {
        for (KindOfParticle& k : particles)
        {
            switch (k.kind)
            {
            case Kind::Falling:
                moveParticle(k.particle, DELTA);
                break;
            case Kind::Floating:
                floatParticle(k.particle, DELTA);
                break;
            }
        }
    });
}
In the preceding code, the switch reads each particle's kind, and calls moveParticle or floatParticle, with its case labels level with its braces, as Chapter 4 set out. The third way is the simplest of all:
// Or keep each kind in a vector of its own, and never ask
double timeTwoVectors(std::vector<Particle>& falling,
                      std::vector<Particle>& floating)
{
    return timeIt([&falling, &floating]()
    {
        for (Particle& p : falling)
            moveParticle(p, DELTA);
        for (Particle& p : floating)
            floatParticle(p, DELTA);
    });
}
In the preceding code, the falling particles and the floating ones are in two vectors, and each loop knows what kind it's moving, so nothing is ever asked. The tests vary one more thing, too: whether the two kinds are mixed together, as a coin toss decided them, or in blocks, every falling particle first and then every floating one. Here's how the six tests did:
Two kinds of particle, half falling, half floating:
  two vectors, one for each kind             1.53 ms
  switch, the kinds in blocks                1.63 ms
  switch, the kinds mixed                    4.42 ms
  virtual, the kinds in blocks               3.70 ms
  virtual, the kinds mixed                   7.14 ms
  virtual, the kinds mixed, sorted          15.49 ms
In the preceding output, the two vectors took 1.53 milliseconds, and the switch, with the kinds in blocks, barely more, at 1.63. Mixed, the switch took 4.42. The virtual calls took 3.70 with the kinds in blocks, 7.14 with them mixed, and 15.49 mixed and then sorted, ten times as long as the two vectors. Figure 29.6 draws them to scale.
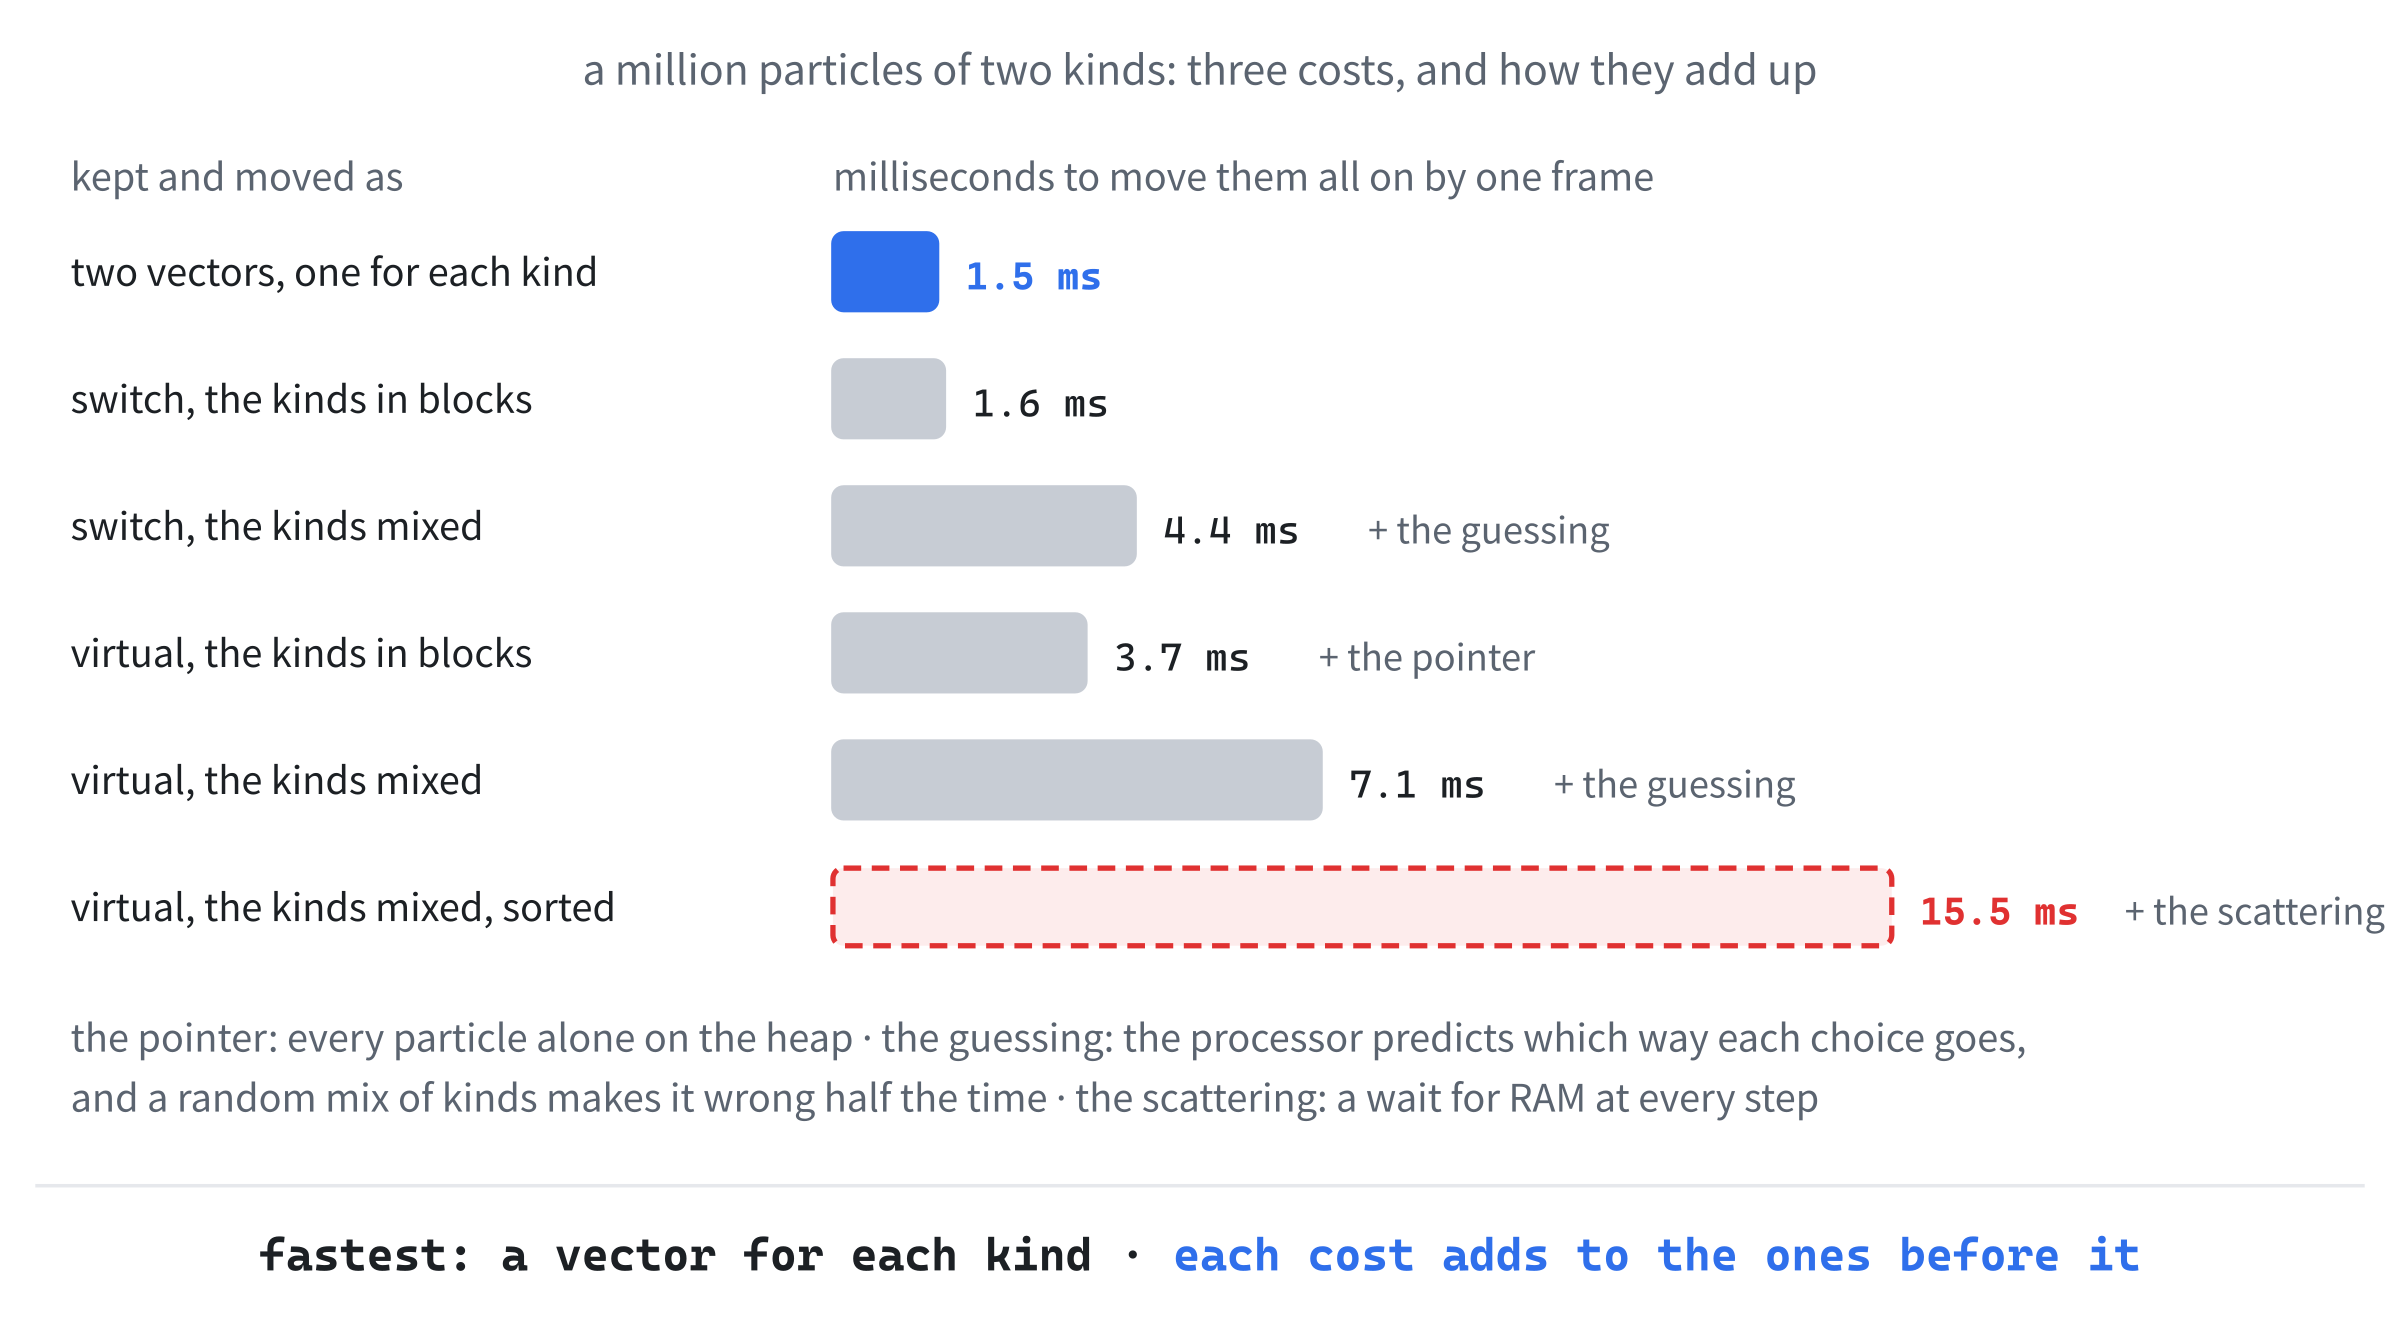
Three different costs add up here, and the tests pull them apart:
- The pointer. Each
MovingParticlelives alone on the heap, like the particles in Pointers to Particles, so even with the kinds in blocks, the virtual calls took more than twice as long as theswitch, which keeps its particles side by side. - The guessing. A modern processor doesn't wait to find out which way a
switchor anifwill go, or which function a virtual call will reach. It predicts, from what happened before, and carries on, which is called branch prediction. When it's right, the choice is almost free, and when it's wrong, it throws away the work it did on the wrong path, and starts again. With the kinds in blocks, it's right nearly every time, and with them mixed by coin tosses, it's wrong about half the time, which cost theswitchnearly three milliseconds, and the virtual calls about 3.5. - The scattering. Sorting scatters the order in which the particles are visited, as it did for the pointers, and every call waits for RAM.
So what should a game do? Most of the time, nothing: Chapter 22 was right that for a few hundred objects, you'll never measure the difference.
For a hundred thousand, change COUNT to 100000 and run the program again. On my computer, the mixed virtual calls took 0.60 milliseconds a frame, and the two vectors 0.17, which is about four percent of a sixtieth of a second, against one percent: worth knowing about, and probably not yet worth changing.
At a million, the virtual calls, mixed and scattered, take nearly a whole frame by themselves, and the answers are clear. Keep each kind in a vector of its own when the kinds needn't be mixed, sort by kind when they must be, and use a switch when there are only a few kinds, and they rarely change. Virtual functions still belong wherever they make the code clearer, which, outside the hottest loops, is nearly everywhere.
Finding the Slow Part
Everything so far has been an experiment, set up to show one effect at a time. A real game is different: you don't know where its time goes, and guessing is famously unreliable, even for experienced programmers.
The tool for finding out is a profiler, and Visual Studio has one built in, as Chapter 24 mentioned. With the configuration set to Release, choose Debug > Performance Profiler, or press Alt+F2. On the page that opens, check CPU Usage, and click Start. Visual Studio runs the program, samples what it's doing about a thousand times a second, and when the program ends, shows a report. Figure 29.7 is part of the report for Particle Timings.
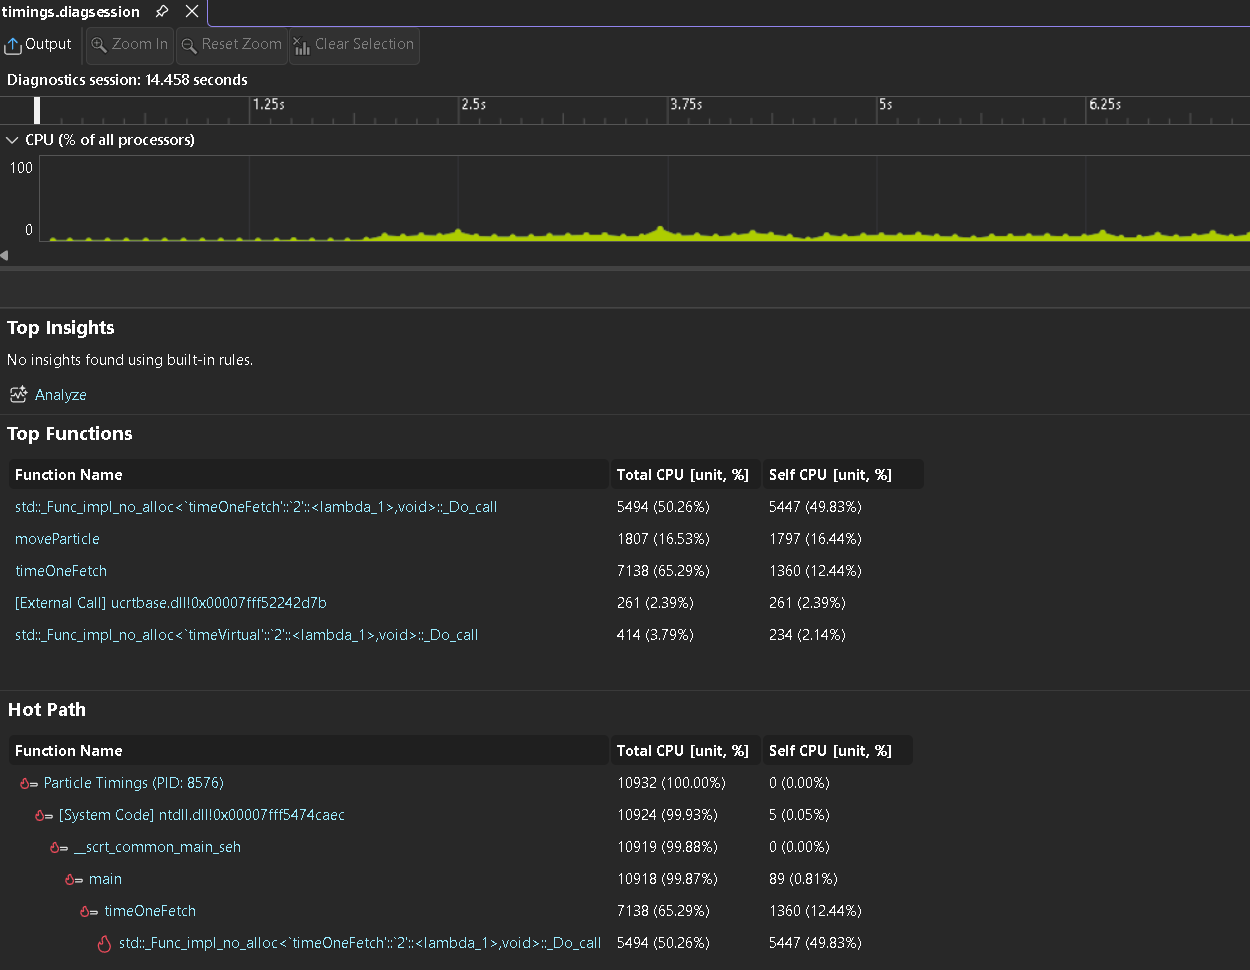
The report has two lists. Top Functions ranks the functions by the time spent in them, where Total CPU counts the time spent in a function and in everything it called, and Self CPU only the time in its own code. The Hot Path starts at the program and follows the most expensive call at each level, down to where the time really went.
Here, half of it went to one line, at = next[at];, in the lambda that follows the chain, whose odd name, beginning std::_Func_impl_no_alloc, is how std::function calls a lambda. Another sixth went to moveParticle, which nearly every test calls a million times a frame. Double-click a function in either list, and Visual Studio shows more detail about it.
A profiler earns its keep on real programs, where the answers are often a surprise. The most famous advice on the subject comes from Donald Knuth, one of computer science's great teachers, who wrote in 1974 that "premature optimization is the root of all evil." He went on to say that the small part of a program where speed really matters deserves all the care you can give it, and the profiler is how you find that small part.
Reach for data locality when:
- A profiler shows that a loop over many objects is where the time goes.
- The loop runs every frame, over thousands of objects or more.
- A simpler fix, such as doing less work, doesn't do the job.
Leave it alone when:
- You haven't measured.
- The loop runs over a few hundred objects, or once at startup.
- The game already runs as fast as it needs to.
And a few habits cost nothing, and are worth having from the start: keep objects themselves in vectors, unless something needs to point to them; reach for a vector before any other container; keep the members a loop reads every frame together, and the rest elsewhere; and check sizeof when you're about to make a lot of something.
If this chapter has caught your interest, read the Data Locality chapter of Robert Nystrom's Game Programming Patterns, which it grew from. The pattern and its name are his, and so are several of the ideas measured here: particles as the example, splitting hot data from cold, and the choices for a loop over objects of different kinds. The experiments, the code, and the timings are our own. His chapter, like the rest of his book, is free to read online, at gameprogrammingpatterns.com.
AI Exercise (Optional)
Data layout depends on the details, which makes it a good subject to think through with an AI chatbot: not to be handed a correct answer, but to have your reasoning tested. As always, use a regular chatbot, in its ordinary chat window, and read what it says with care.
Paste in this prompt:
"I'm learning about data locality in C++. My 2D shoot-'em-up updates about 10,000 bullets every frame. Each bullet has a position (x and y, floats), a velocity (vx and vy, floats), a damage value (an int), the ID of whoever fired it (an int), a sprite number (an int), and an active flag (a bool). Every frame, an update pass moves every active bullet and checks whether it has left the screen; a collision pass checks each active bullet's position against the enemies, and uses its damage and owner when it hits one; and a draw pass uses each active bullet's position and sprite. Please do four things. First, show an array-of-structures layout and a structure-of-arrays layout for the bullets. Second, say which members are hot in each of the three passes, and which are cold. Third, recommend one layout, and explain why. Fourth, tell me honestly about one downside of the layout you recommended."
Notice what the prompt does. It gives real numbers and real passes, so the answer can be about this game rather than games in general, and it names every member and which pass reads it, so the hot and cold question has something to bite on. And it asks for the recommendation's downside, which is the most useful part: every layout has a cost, and an answer that doesn't name one is a sales pitch.
When the answer comes back, judge it:
- Did it notice the active flag? Every pass reads it, just as every pass reads the position, so it's as hot as the position, even though it's only one byte.
- Did it put damage and owner in the right place? Only the collision pass reads them, and only when a bullet hits something.
- Did it think about size? Ten thousand bullets of about 32 bytes each come to about 300 KB, which fits in the L2 cache of many computers. The honest answer may be that the layout barely matters, and that the only way to know is to time it. Does the AI say so?
Then push back on the layout it chose. "How would I pass one bullet to a function that handles a hit?" is a good question for a structure of arrays, and "Wouldn't the collision pass be faster with the positions in arrays of their own?" is a good one for an array of structures. Either way, the answers teach you the trade-off from both sides.
Summary
Data locality is about where your data sits, and it can matter more than the code that works on it. Memory is a ladder, from caches that answer in about a nanosecond to RAM that takes 60 to 80, and a loop runs fast when the processor can see what it needs coming. The particles themselves, side by side in a vector, beat every layout that scattered them: a linked list, pointers, fat structures, and virtual calls through objects on the heap all made the same work slower, from twice as long to over thirty times. Splitting hot data from cold kept a fat particle's loop as quick as a lean one's, structures of arrays did better still for a loop that uses a few members, and a vector for each kind beat both a switch and virtual calls. Above all, you've seen how to measure, in a Release build, with the best of several tries, and with a profiler, and why measuring beats guessing.
This chapter ends the book's theory. Starting from a single variable, you've learned the language, built classes and families of them, met the wider C++ world, programmed with an AI, and seen two patterns that real game engines are built on. Next comes the final project: a whole game, built over the rest of the book with everything you've learned.